Metrics
Metrics mean everything when it comes to determining results. It's important to track social media metrics, to avoid wasting time and resources on ineffective social media content.
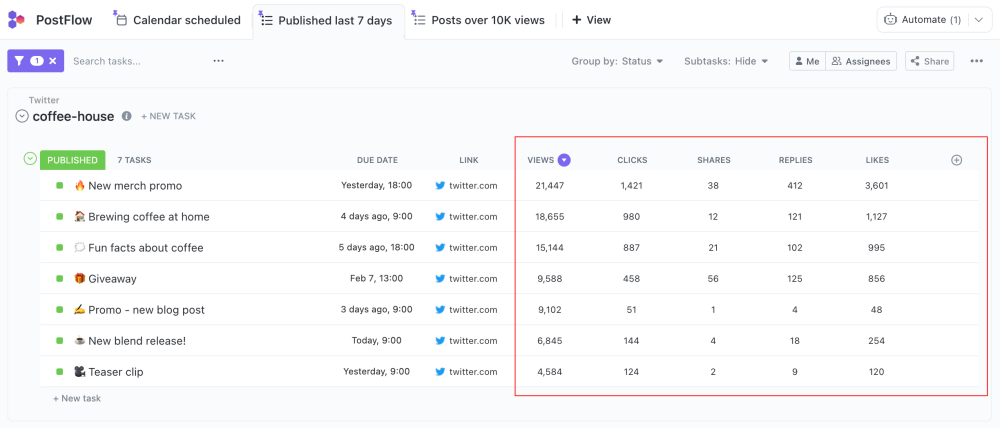
PostFlow automatically brings your post metrics into your workspace.
You can use these metrics:
- in sorting by value
- in custom formulas for KPIs
- in your dashboards, i.e. visualisation using graphs
- build your goals on top of them
- across the ClickUp workspace
Social Media KPIs
To measure the success of your social media strategy, you have to set KPIs that match your goals. In the following section, we will look at how you can further work with the metrics provided by PostFlow. The examples are illustrative and can be modified to suit your goals.
For calculation, we will use ClickUp formula fields
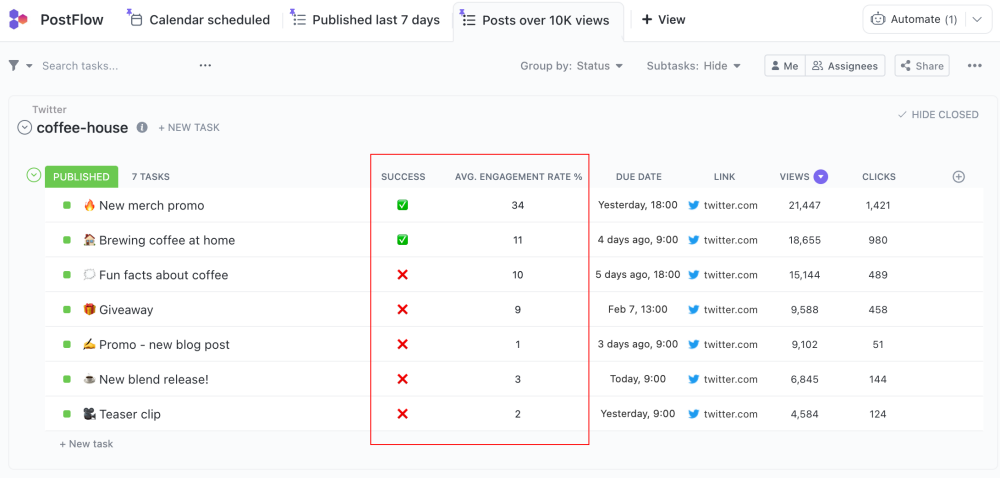
Successful post:
The following formula evaluates a post as successful if
it has received more than 10000 views and more than 100 clicks.
IF(AND(field("Views") > 10000, field("Clicks") > 100), "✅", "❌")
Average engagement rate:
The average engagement rate measures the interactions associated with your content in proportion to your followers not just the total number of your metrics. Ultimately, engagement metrics are more important than reach.
General formula
Average Engagement Rate Percentage = (Likes + Comments + Shares) / Followers × 100
ClickUp formula
SUM(field("Replies"), field("Likes"),field("Shares")) / TOTAL_FOLLOWERS * 100
Social media networks
The following table describes the meaning and availability of metrics against each social media network.
| Views | Clicks | Shares | Replies | Likes | |
|---|---|---|---|---|---|
| ✅ | ✅ profile clicks |
✅ retweet + quote |
✅ | ✅ | |
| LinkedIn - page | ✅ | ✅ | ✅ | ✅ | ✅ |
| LinkedIn - personal | - | - | - | ✅ | ✅ |
| ✅ | ✅ | ✅ | ✅ | ✅ total reactions |
|
| ✅ | ✅ | ✅ total saved |
✅ | ✅ |